2022 is shaping up to be a clear turning point for investors.
Despite the odd period of volatility, which was usually short-lived, traditional financial markets were by and large very kind over the past ten plus years, with large gains seen in stocks, real estate and in bonds.
New age assets like cryptocurrencies also soared, as low interest rates encouraged rampant speculation.
Cost of living pressures were also largely contained, with the period between 2010 and 2020 marking one of the slowest decades on record for increases in inflation.
It was in many ways the perfect world, and perfect time to invest.
All that is over now though, with 2022 the year that we are seeing large scale losses across multiple asset classes, plus soaring cost of living, or inflation pressures.
This new investing world, which may last for some time, has solidified in the minds of many astute investors exactly why they need to own hard assets, so that they can protect their portfolio through this period.
This continues to be a source of support for pink diamond demand, and for pink diamond prices. We expect this will continue to be the case, due to the latest inflation and investment news, which we explore below.
Could inflation really hit 10% per annum?
You have to go back to the 1970s and early 1980s for the last time we had a serious inflation breakout, with many years of skyrocketing prices.
We are now living in the midst of another breakout, with inflation already above 8% in the United States, and more than 5% in Australia.
The breakout, and how rapidly it has evolved is clear in the chart below, which shows US inflation rates going back to 1980.
Inflation – USA – % annual change
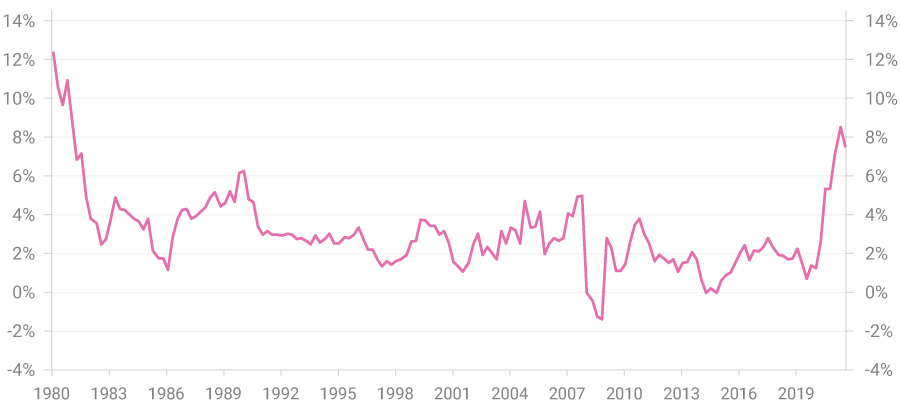
Source: Bureau of Labor Statistics.
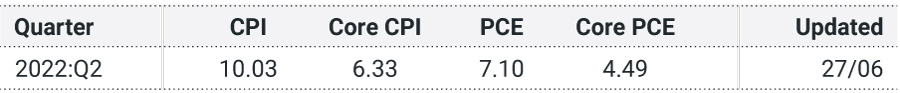
This week, we saw the incredible suggestion that inflation could soon top 10%, as per the current reading from an inflation forecasting model (see table below) designed by none other than the Federal Reserve.
Quarterly Inflation Nowcasting
Quarterly annualized percent change
In Australia, we’ve already had the Reserve Bank suggest inflation will top 7% by Christmas this year, with a recent survey by Finder suggesting grocery bills are now the number one cause of financial stress for Australian households.
Australian Federal Treasurer Jim Chalmers has also warned of ‘significantly higher’ inflation, noting the situation will ‘get worse before it gets better’.
Given this backdrop, the reality is that for most Australians, their real wage is going to go backwards. Their portfolios are also declining in value.
That’s a negative for consumer spending and company profits, and most likely share market valuations, while it also adds to the pressure the property market is facing.
While inflation will hopefully peak by later this year or by early 2023, it seems clear that the multi-decade era of low and/or falling inflation is now in the rear-view mirror.
That alone supports the case for investing in hard assets like pink diamonds going forward.
Diversification will also drive diamond demand
High inflation will not be the only driver of pink diamond demand, and pink diamond prices going forward.
Their beauty, and their rarity, the latter of which was exacerbated by the closure of the Argyle Mine almost two years ago, are also factors driving this market.
Diversification also remains important. Astute investors realise that now, more than ever, they need a solid mix of different asset classes in their portfolio.
The traditional method for building wealth, which quite simply was modelled around holding a portfolio of stocks and bonds, is unlikely to do well in the coming decades.
To contextualise this, it’s worth considering how poorly traditional portfolios have performed over multiple decades in the past where inflation was higher.
The table below, sourced here, does just this, showing the returns on stocks, bonds, and a 60/40 portfolio of stocks and bonds, as well as inflation rates and yields between 1941-1981 (a bad period for investors), and then 1982-2021 (the golden era we’ve just been through).
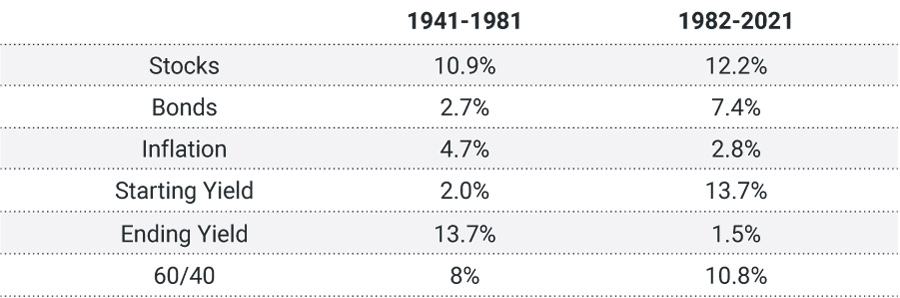
Sources: NYU, Shiller, S&P 500 and 10 Year Treasury.
While a total return of 8% per annum between 1941-1981 doesn’t sound too bad, it needs to be remembered that inflation was 4.7% per annum each year in this period, while taxes need to be paid as well.
Indeed, if we assume a 30% tax rate, the ‘real return’ on portfolios between 1941-1981 was likely barely 1%, about one-fifth of what real returns have been over the last four decades.
While the financial media will be only too happy to focus on what happens to the stock market or the price of oil in the next week, those things won’t actually affect the big picture in any meaningful way.
Instead, the focus should be on navigating a multi-year and possibly even decade long period where traditional asset returns are constrained or even negative, while alternative hard assets like pink diamonds are set to thrive.
As always, we hope you’ve enjoyed this week’s edition of “In the Loupe” and we look forward to any questions or comments you may have.
Diamond demand strong as inflation to hit 10 per cent?
2022 is shaping up to be a clear turning point for investors.
Despite the odd period of volatility, which was usually short-lived, traditional financial markets were by and large very kind over the past ten plus years, with large gains seen in stocks, real estate and in bonds.
New age assets like cryptocurrencies also soared, as low interest rates encouraged rampant speculation.
Cost of living pressures were also largely contained, with the period between 2010 and 2020 marking one of the slowest decades on record for increases in inflation.
It was in many ways the perfect world, and perfect time to invest.
All that is over now though, with 2022 the year that we are seeing large scale losses across multiple asset classes, plus soaring cost of living, or inflation pressures.
This new investing world, which may last for some time, has solidified in the minds of many astute investors exactly why they need to own hard assets, so that they can protect their portfolio through this period.
This continues to be a source of support for pink diamond demand, and for pink diamond prices. We expect this will continue to be the case, due to the latest inflation and investment news, which we explore below.
Could inflation really hit 10% per annum?
You have to go back to the 1970s and early 1980s for the last time we had a serious inflation breakout, with many years of skyrocketing prices.
We are now living in the midst of another breakout, with inflation already above 8% in the United States, and more than 5% in Australia.
The breakout, and how rapidly it has evolved is clear in the chart below, which shows US inflation rates going back to 1980.
Inflation – USA – % annual change
Source: Bureau of Labor Statistics.
This week, we saw the incredible suggestion that inflation could soon top 10%, as per the current reading from an inflation forecasting model (see table below) designed by none other than the Federal Reserve.
Quarterly Inflation Nowcasting
Quarterly annualized percent change
In Australia, we’ve already had the Reserve Bank suggest inflation will top 7% by Christmas this year, with a recent survey by Finder suggesting grocery bills are now the number one cause of financial stress for Australian households.
Australian Federal Treasurer Jim Chalmers has also warned of ‘significantly higher’ inflation, noting the situation will ‘get worse before it gets better’.
Given this backdrop, the reality is that for most Australians, their real wage is going to go backwards. Their portfolios are also declining in value.
That’s a negative for consumer spending and company profits, and most likely share market valuations, while it also adds to the pressure the property market is facing.
While inflation will hopefully peak by later this year or by early 2023, it seems clear that the multi-decade era of low and/or falling inflation is now in the rear-view mirror.
That alone supports the case for investing in hard assets like pink diamonds going forward.
Diversification will also drive diamond demand
High inflation will not be the only driver of pink diamond demand, and pink diamond prices going forward.
Their beauty, and their rarity, the latter of which was exacerbated by the closure of the Argyle Mine almost two years ago, are also factors driving this market.
Diversification also remains important. Astute investors realise that now, more than ever, they need a solid mix of different asset classes in their portfolio.
The traditional method for building wealth, which quite simply was modelled around holding a portfolio of stocks and bonds, is unlikely to do well in the coming decades.
To contextualise this, it’s worth considering how poorly traditional portfolios have performed over multiple decades in the past where inflation was higher.
The table below, sourced here, does just this, showing the returns on stocks, bonds, and a 60/40 portfolio of stocks and bonds, as well as inflation rates and yields between 1941-1981 (a bad period for investors), and then 1982-2021 (the golden era we’ve just been through).
Sources: NYU, Shiller, S&P 500 and 10 Year Treasury.
While a total return of 8% per annum between 1941-1981 doesn’t sound too bad, it needs to be remembered that inflation was 4.7% per annum each year in this period, while taxes need to be paid as well.
Indeed, if we assume a 30% tax rate, the ‘real return’ on portfolios between 1941-1981 was likely barely 1%, about one-fifth of what real returns have been over the last four decades.
While the financial media will be only too happy to focus on what happens to the stock market or the price of oil in the next week, those things won’t actually affect the big picture in any meaningful way.
Instead, the focus should be on navigating a multi-year and possibly even decade long period where traditional asset returns are constrained or even negative, while alternative hard assets like pink diamonds are set to thrive.
As always, we hope you’ve enjoyed this week’s edition of “In the Loupe” and we look forward to any questions or comments you may have.
Related posts: